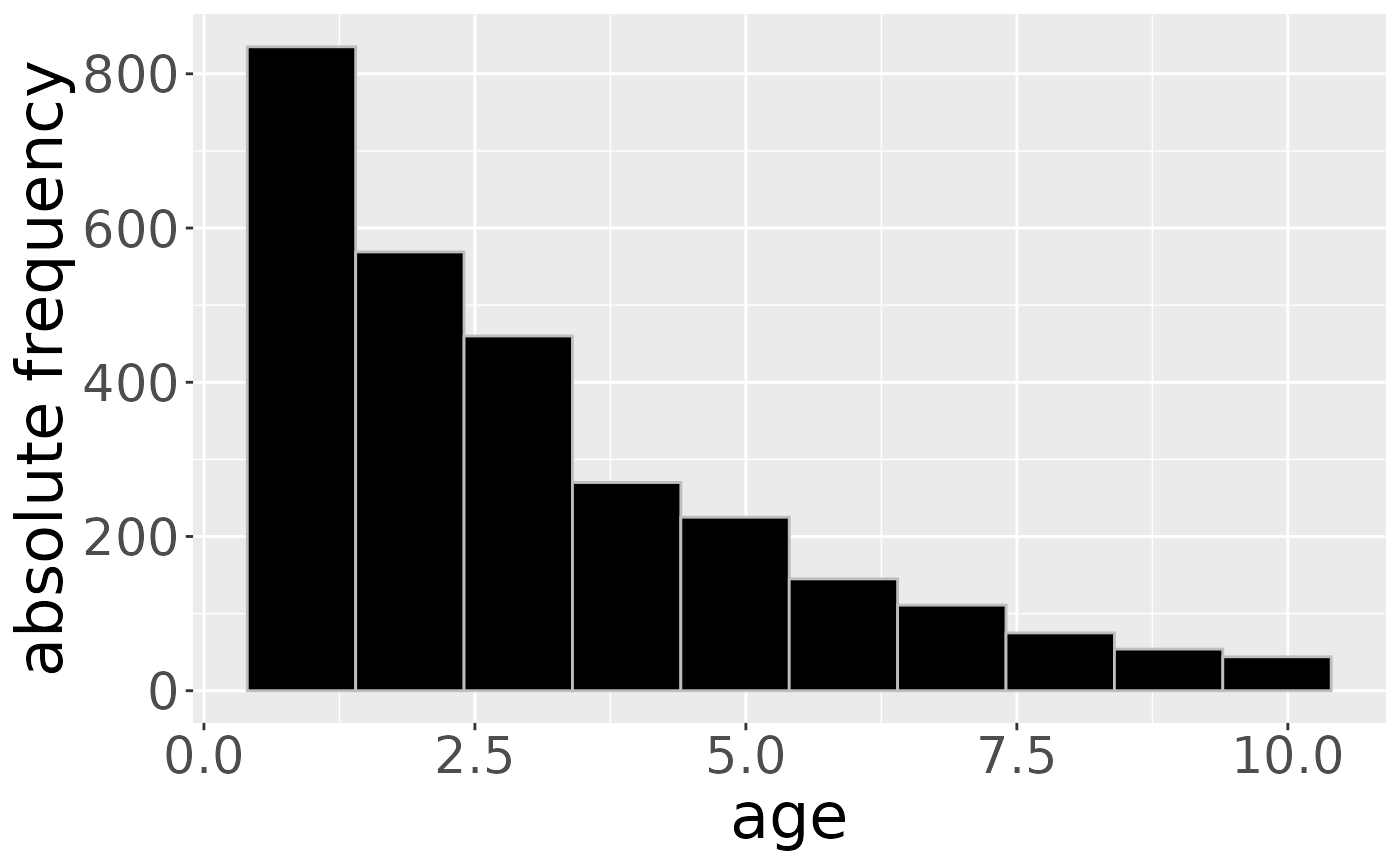
plot age distribution of raw recoveries of real world data
Source:R/plotAgeDistribution.R
plotAgeDistribution.RdThis function plots the age distribution of recoveries in the real world data as a histogram.
plotAgeDistribution(
  markRecaptureObject,
  pdf = FALSE,
  pdfName = "ageDistribution.pdf"
)
Arguments
| markRecaptureObject | object of class markRecaptureObject (see markRecaptureObject()) |
|---|---|
logical, saves image as pdf-file if TRUE. Defaults to FALSE. |
|
| pdfName | string to name pdf-file, please include ".pdf"! |
Value
histogram of age of raw recoveries, depending on arguments plot as pdf or to plot to device
Examples
plotAgeDistribution(mro2D)