plot goodness of fit for linear model used to estimate parameter functions
Source:R/plotGOFofLM.R
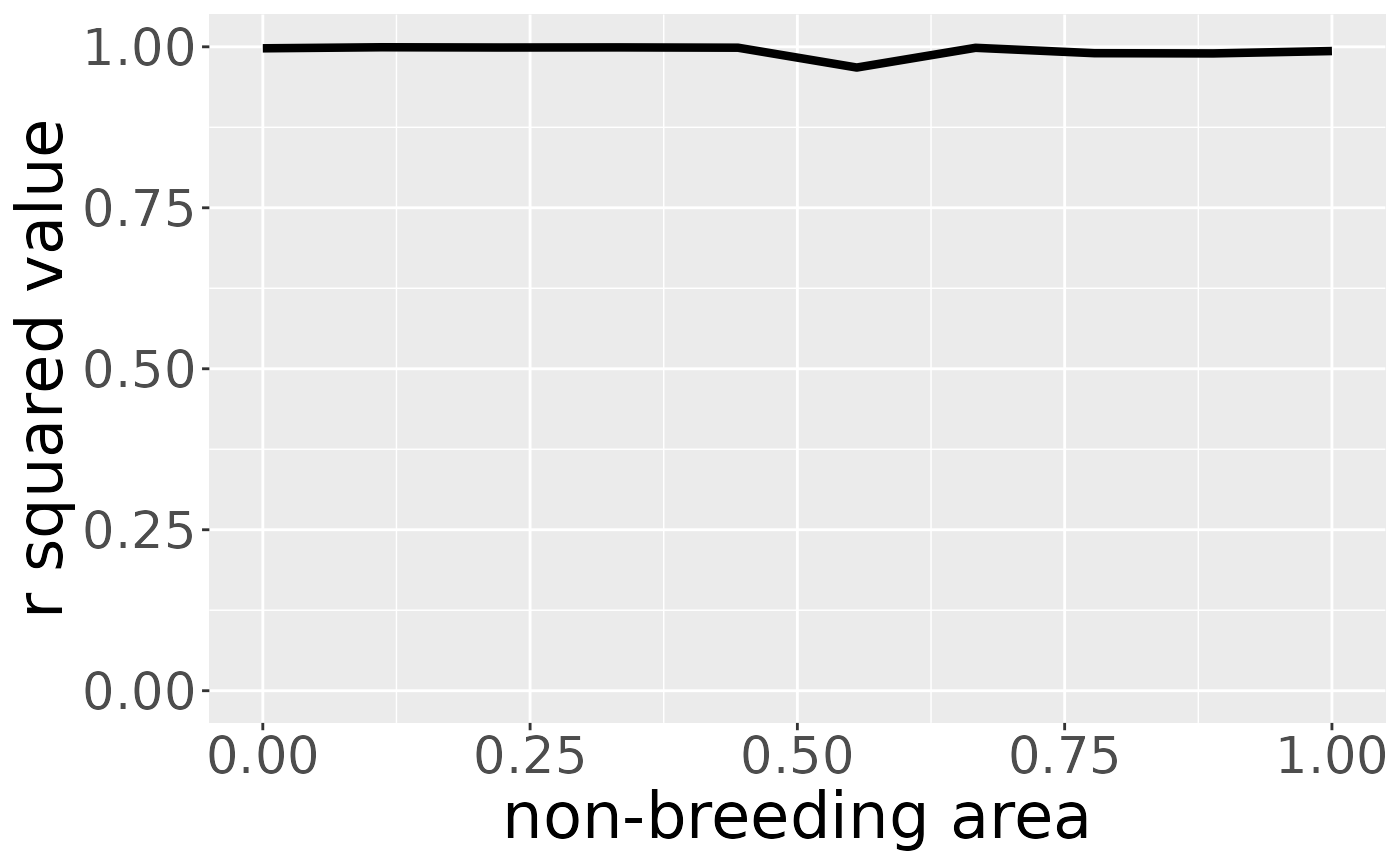
plotGOFofLM.RdThis function plots the R^2 values of the robust or ordinary linear regression used to estimate survival.
plotGOFofLM(
  markRecaptureObject,
  pdf = FALSE,
  xlb = NULL,
  xub = NULL,
  ylb = NULL,
  yub = NULL,
  drawBoundaries = TRUE
)
Arguments
| markRecaptureObject | object of class markRecaptureObject (see markRecaptureObject()) |
|---|---|
logical, saves image as pdf-file if TRUE. Defaults to FALSE. |
|
| xlb | numeric, lower bound of x. Defaults to NULL. |
| xub | numeric, upper bound of x. Defaults to NULL. |
| ylb | numeric, lower bound of y. Defaults to NULL. |
| yub | numeric, upper bound of y. Defaults to NULL. |
| drawBoundaries | logical, country boundaries will be drawn, if TRUE. Defaults to TRUE. |
Value
matrix of dimension res*res with R^2-values for the linear model in every point.
Examples
plotGOFofLM(mro1D)