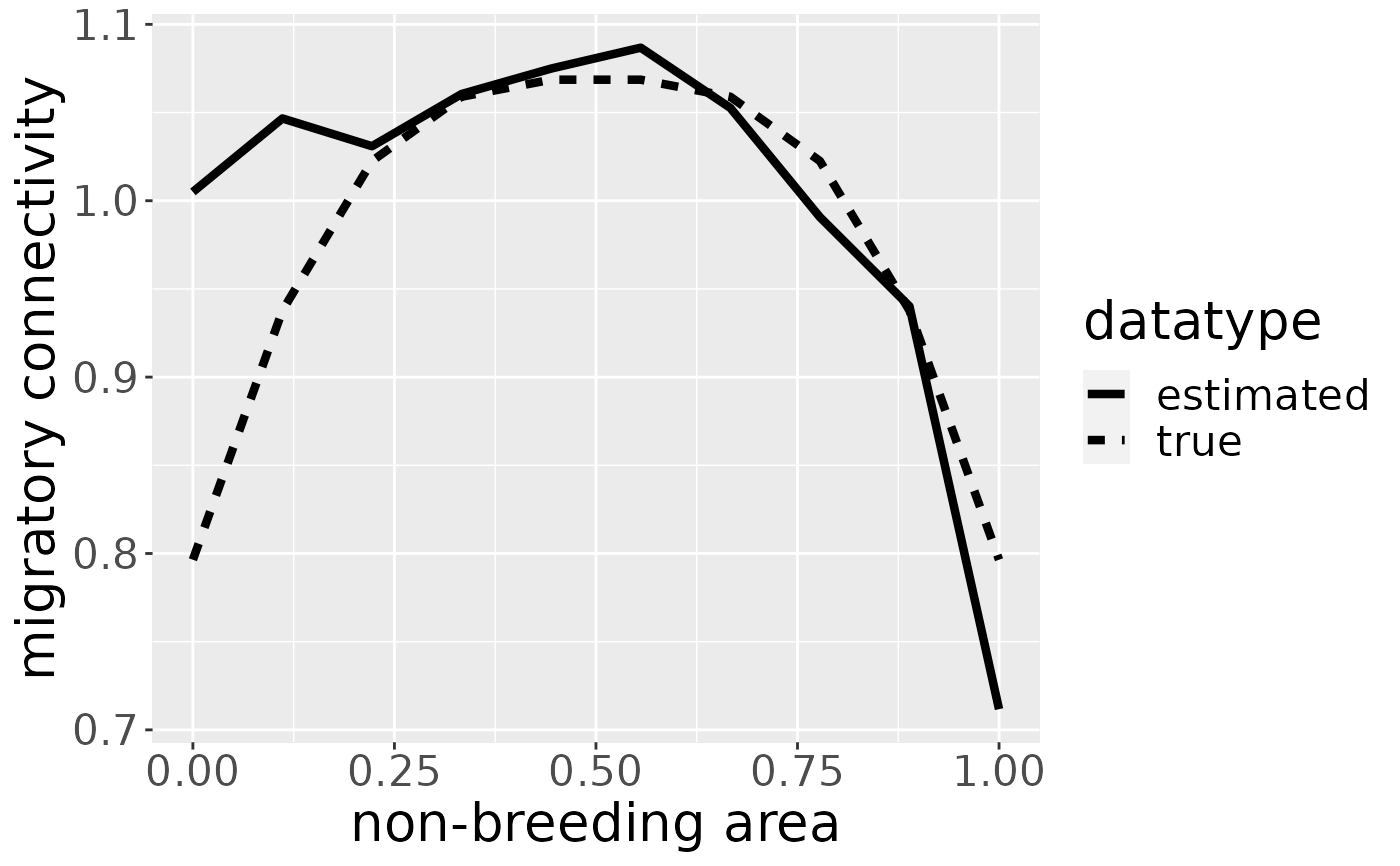
This function plots the kernel density estimate and true density for simulated data.
plotM(
  markRecaptureObject,
  b = "all",
  pdf = FALSE,
  log = FALSE,
  trueValuesAvailable = FALSE,
  uq = 1,
  drawBoundaries = TRUE
)
Arguments
| markRecaptureObject | object of class markRecaptureObject (see markRecaptureObject()) |
|---|---|
| b | specifies breeding area for which the plot is drawn. Can be either a breedingAreaName, the corresponding number of the breeding area or "all" for all breeding areas at once. |
logical, saves image as pdf-file if TRUE. Defaults to FALSE. |
|
| log | plots logarithm of migratory connectivity. Defaults to FALSE. |
| trueValuesAvailable | logical, use TRUE for simulated data, FALSE for real-world data. Defaults to FALSE. |
| uq | upper quantile until which migratory connectivity value is plotted |
| drawBoundaries | logical, country boundaries will be drawn, if TRUE. Defaults to TRUE. |
Value
depending on arguments plot as pdf or to plot device
Examples
plotM(mro1D, trueValuesAvailable = TRUE)